Within weeks of the Great Flood of 1913, Ohio's worst natural disaster to date, citizens of the Miami Valley came together to create the Miami Conservancy District and build a regional flood protection system, with one promise: Neveragain.
Over a century later, that same system is still protecting our families and homes today.
1 million people live, work, and play in the Miami Valley. Our flood protection system safeguards 47,000 properties in 22 cities and five counties from the destruction of riverine flooding every single year.
Our Economy More than $10 billion worth of buildings and land remain dry, accessible, and undamaged no matter the storm. This promise of safety encourages riverfront development and attracts new businesses to our region, boosting the local economy.
Our Schools
Over 60 schools and colleges remain safe from flooding every year, keeping them open and accessible for the bright minds and future generations of southwest Ohio.
Our Hospitals & Roads
11 hospitals and 814 miles of public roads remain accessible and operating even during the worst of storms, ensuring that families can get the care they need, and emergency responders can get to where they need to go.
Our Clean Water
14 wastewater treatment plants and 9 water treatment plants are protected from flood events every year, ensuring uninterrupted access to drinking water and use of toilets, showers, or sinks in our homes.
Our Way Of Life
The Miami Valley has unparalled trail and river access, abundant nature and wildlife, and a unique heritage of innovation. Without flood protection infrastructure for the last century, this region would look very different than what we know today.
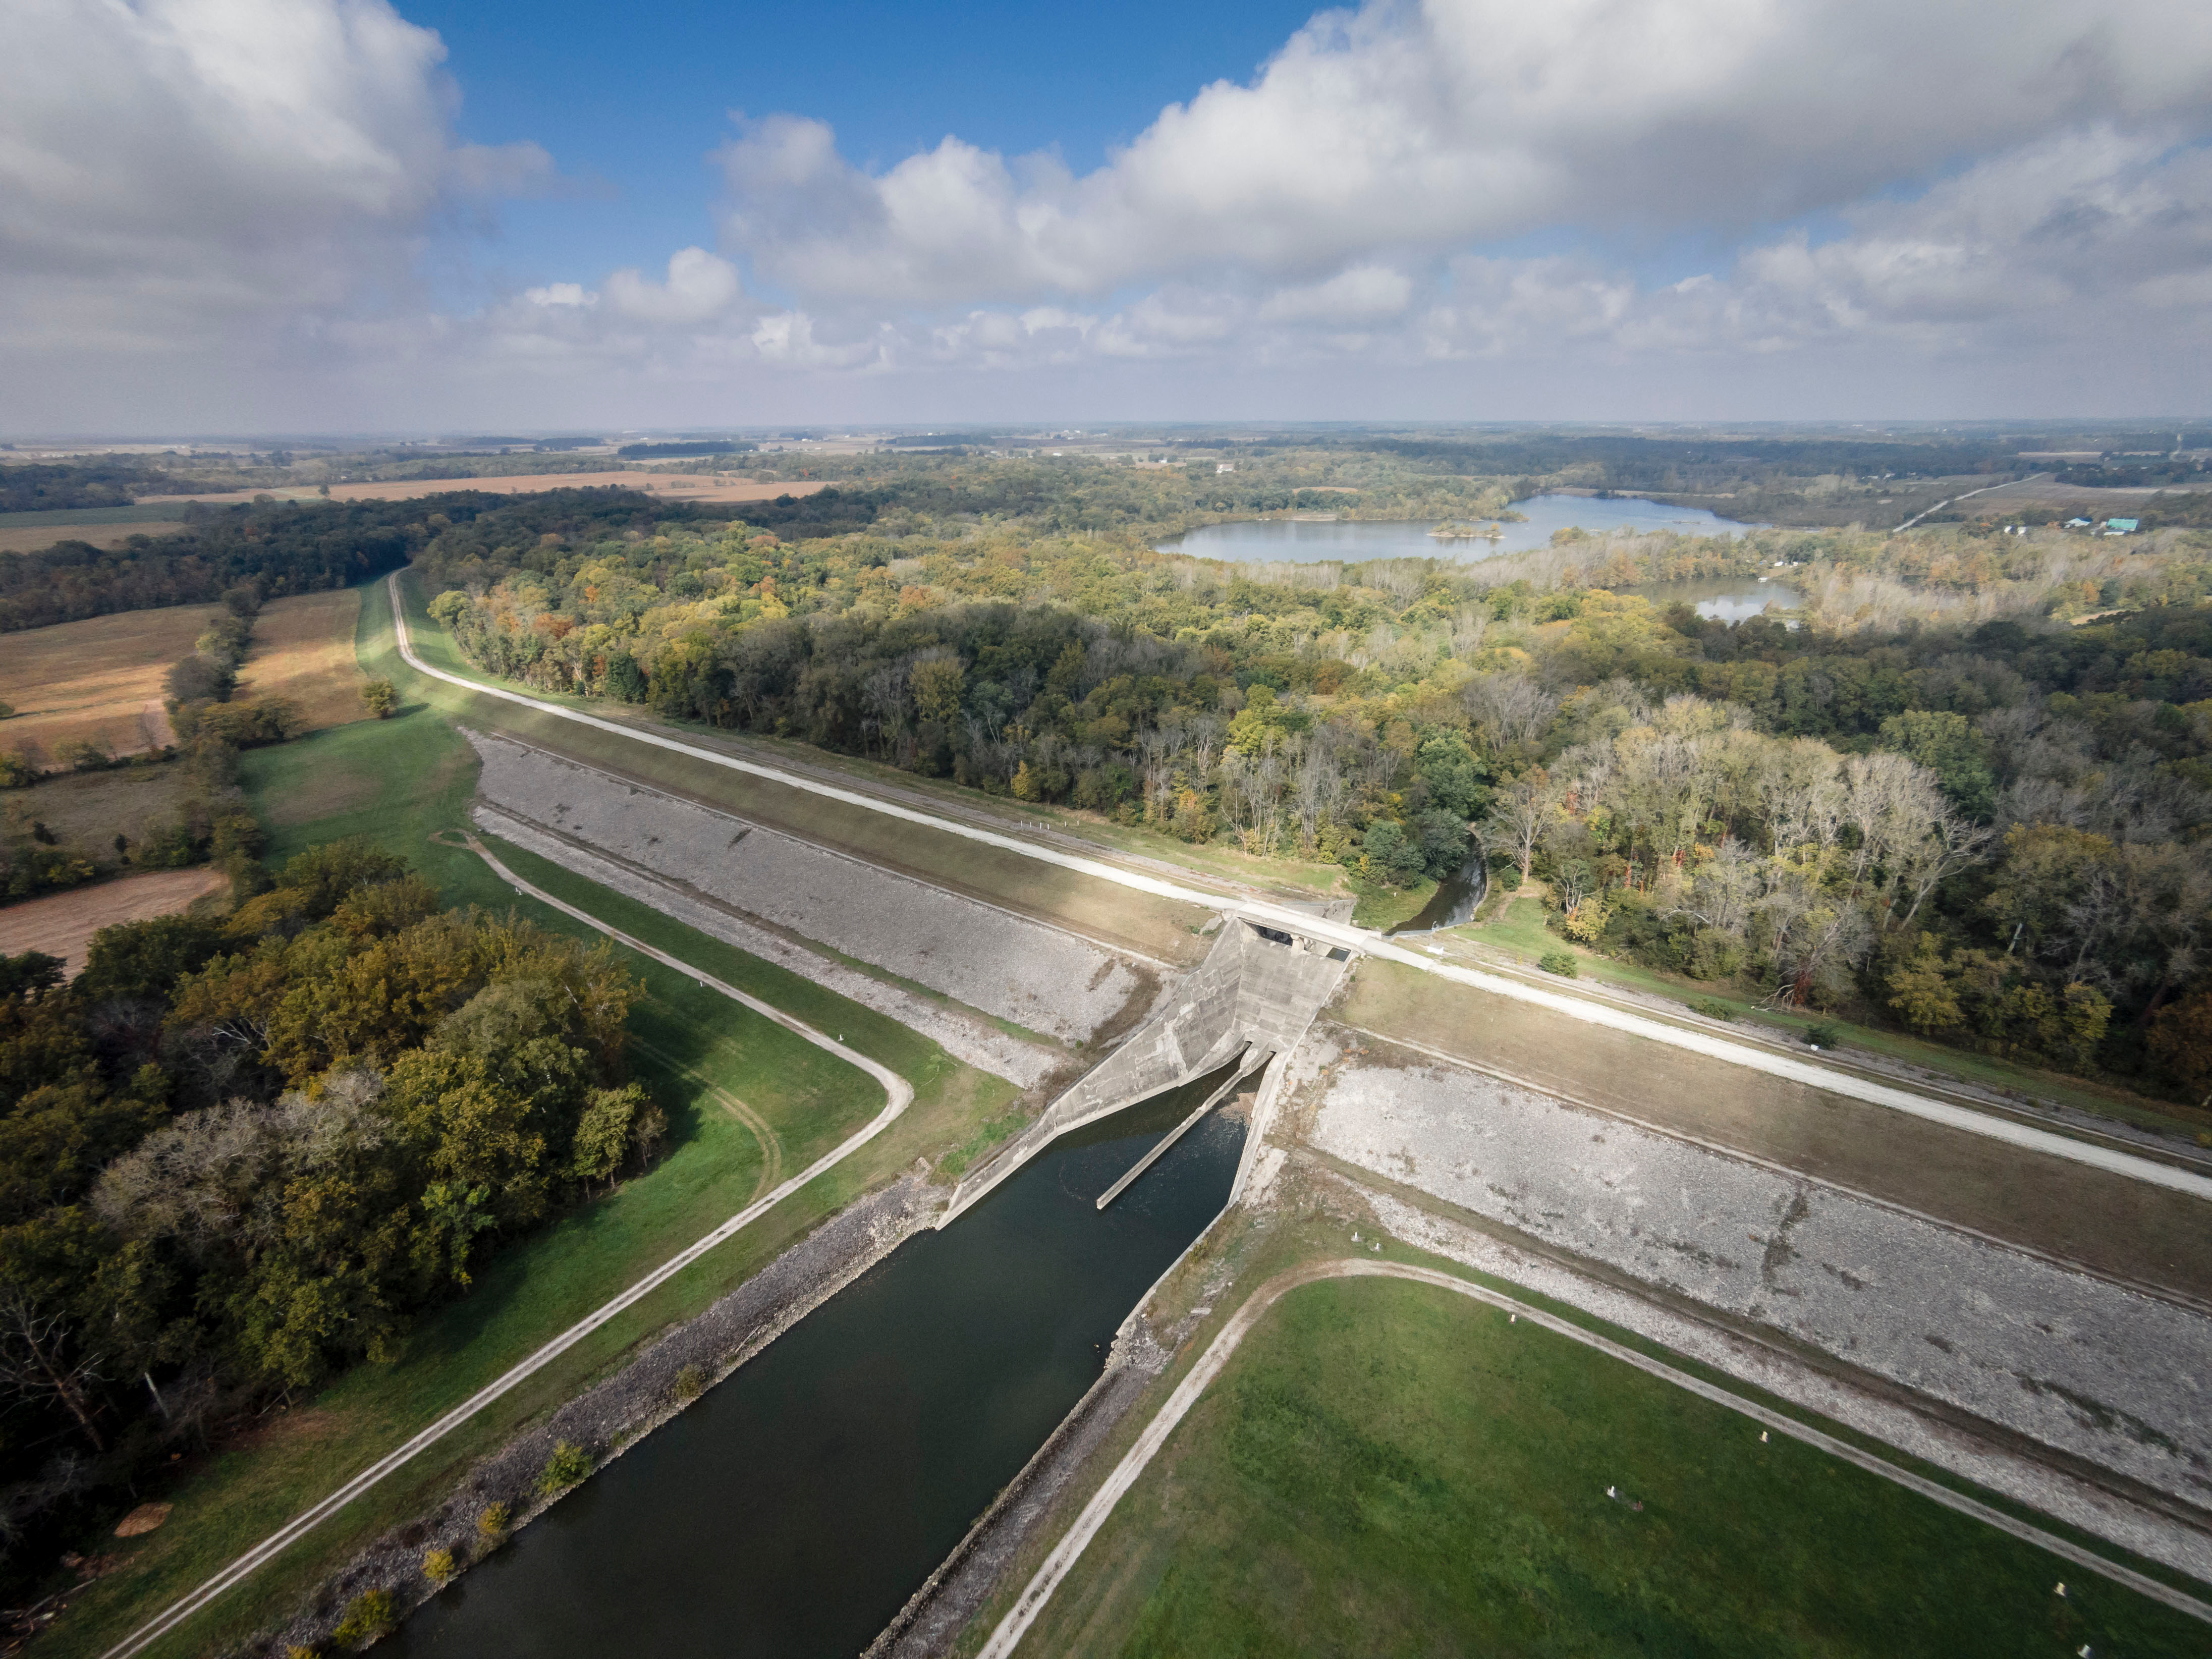
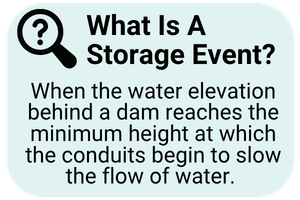
How much can the system store?
The flood protection system is designed to manage a storm the size of the Great Flood of 1913 plus an additional 40 percent.
The total capacity of the flood protection system is called the Official Plan Flood and is 841,000 acre-feet or about 274 billion gallons of water.
Highest Amounts of Water Stored Since 1922
Ranked by size
Date
Amount of Water Stored at Peak (Acre-Feet)
Amount of Water Stored at Peak (Billion Gallons)
1
Jan 22-23, 1959
137,600
44.8
2
Jan 6-8, 2005
114,450
37.3
3
Jun 11-15, 1958
97,690
31.8
4
Jan 14-16, 1937
93,300
30.4
5
Dec 21-24, 2013
93,300
30.4
6
Jan 21-23, 1937
93,200
30.4
7
May 13-15, 1933
86,900
28.3
8
Mar 5-7, 1963
86,690
28.2
9
Feb 26-27, 1929
84,300
27.5
10
Dec 31, 1990
81,300
26.5
11
Jan 27-28, 1952
71,800
23.4
12
April 3-12, 2025
68,950
22.5
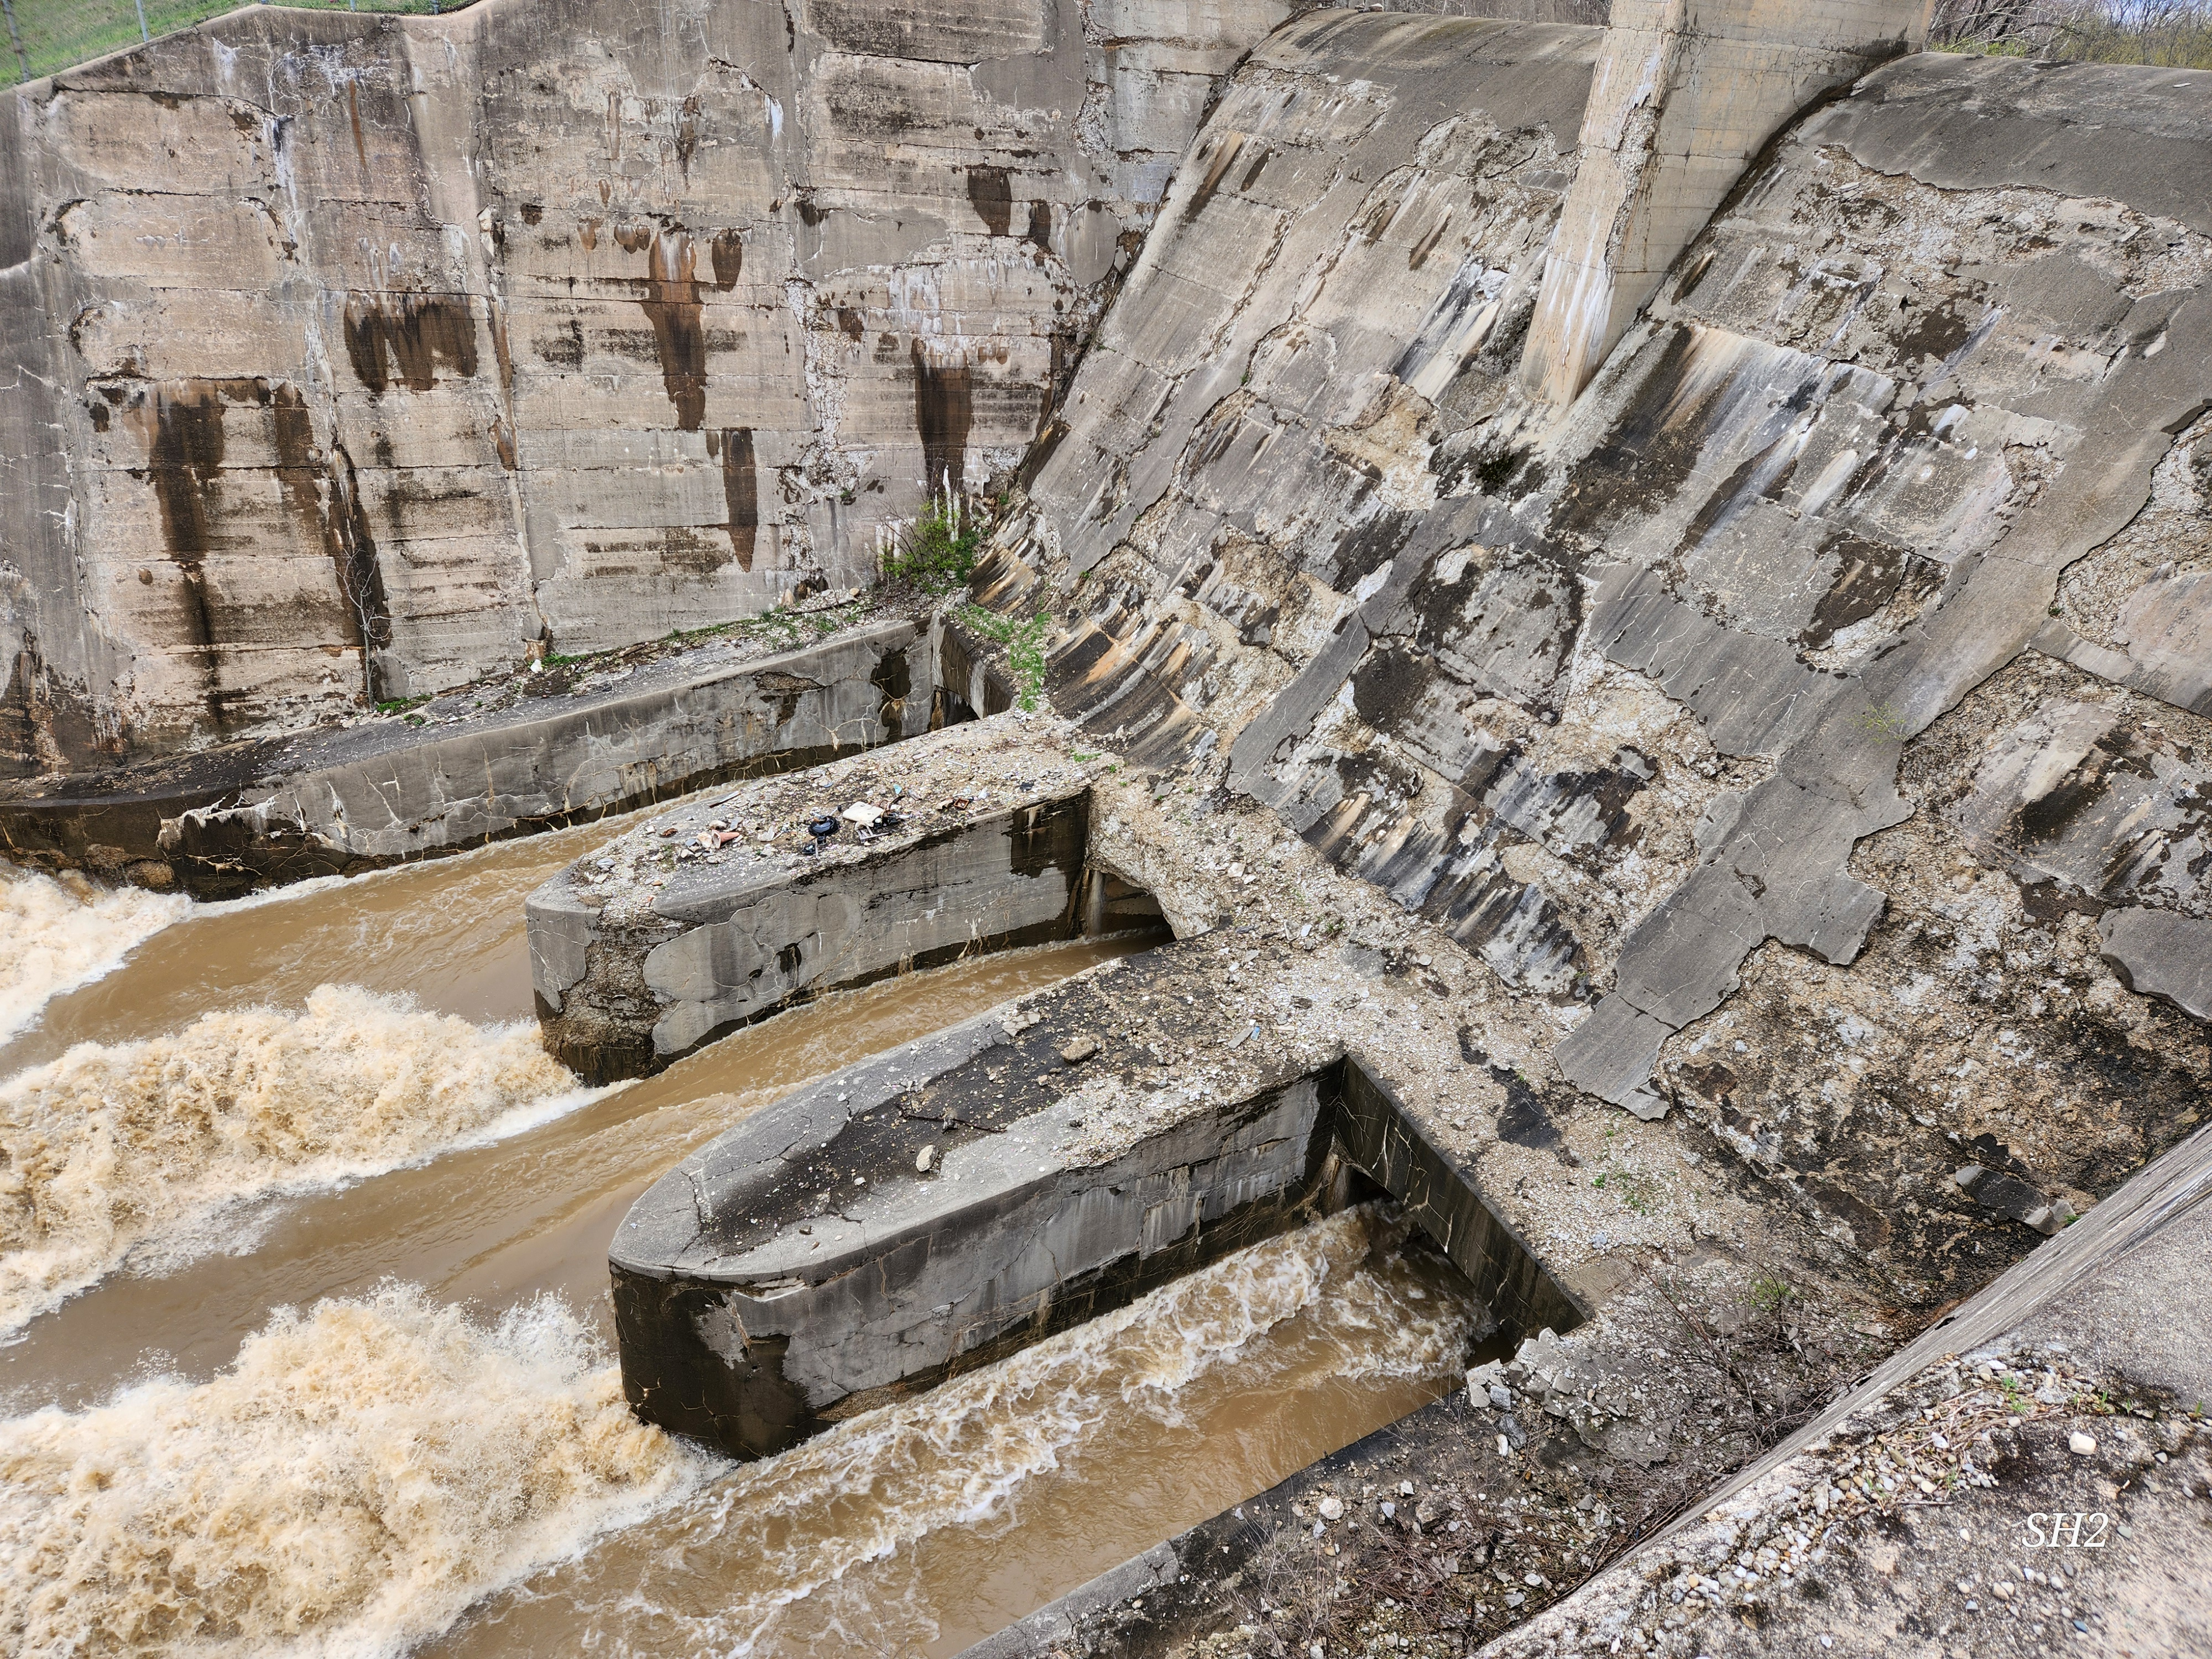
Risks To The System
The dams, levees, and other parts of the flood protection system have worked harder and stored more water in recent decades, resulting in more stress on the system.
1
Aging Infrastructure
More than 100 years old, the dams and levees are aging. Just like roads or bridges, they need maintenance and updating. For the first 50 years, the rehabilitation and repair was minimal, and efforts focused on maintaining the levees.
2 Weather Trends Average precipitation has steadily increased. More frequent high water events mean the dam and levee soils are saturated moreoften and exposed to more frequent erosive forces andhydraulic pressure. Catastrophic flooding is occurring more frequently across the U.S.
 View Map Of The Flood Protection System